
- Enrollment Trends in College
- Growing Total College Enrollment
- Growing College Enrollment by Age
- Growing College Enrollment by Gender
- Growing Full-Time and Part-Time College Enrollment
- College Growth by Degree Level
- Public and Private College Enrollment Trends
- College Freshman Enrollment Growth
- Colleges in Your State
Enrollment Trends in College
Please see below for a summation of enrollment trends in colleges and universities in the United States. The data has been culled from the NCES most recent survey which is managed by the U.S. Department of Education.
Growing Total College Enrollment
This graph shows the actual and projected total enrollment numbers for all degree-granting colleges and universities from 1999 to 2024. The graph depicts a net increase of 37% from 1999 to 2024 with a projected increase in enrollment to 23 million by 2024 which is a 54% increase from 1999.
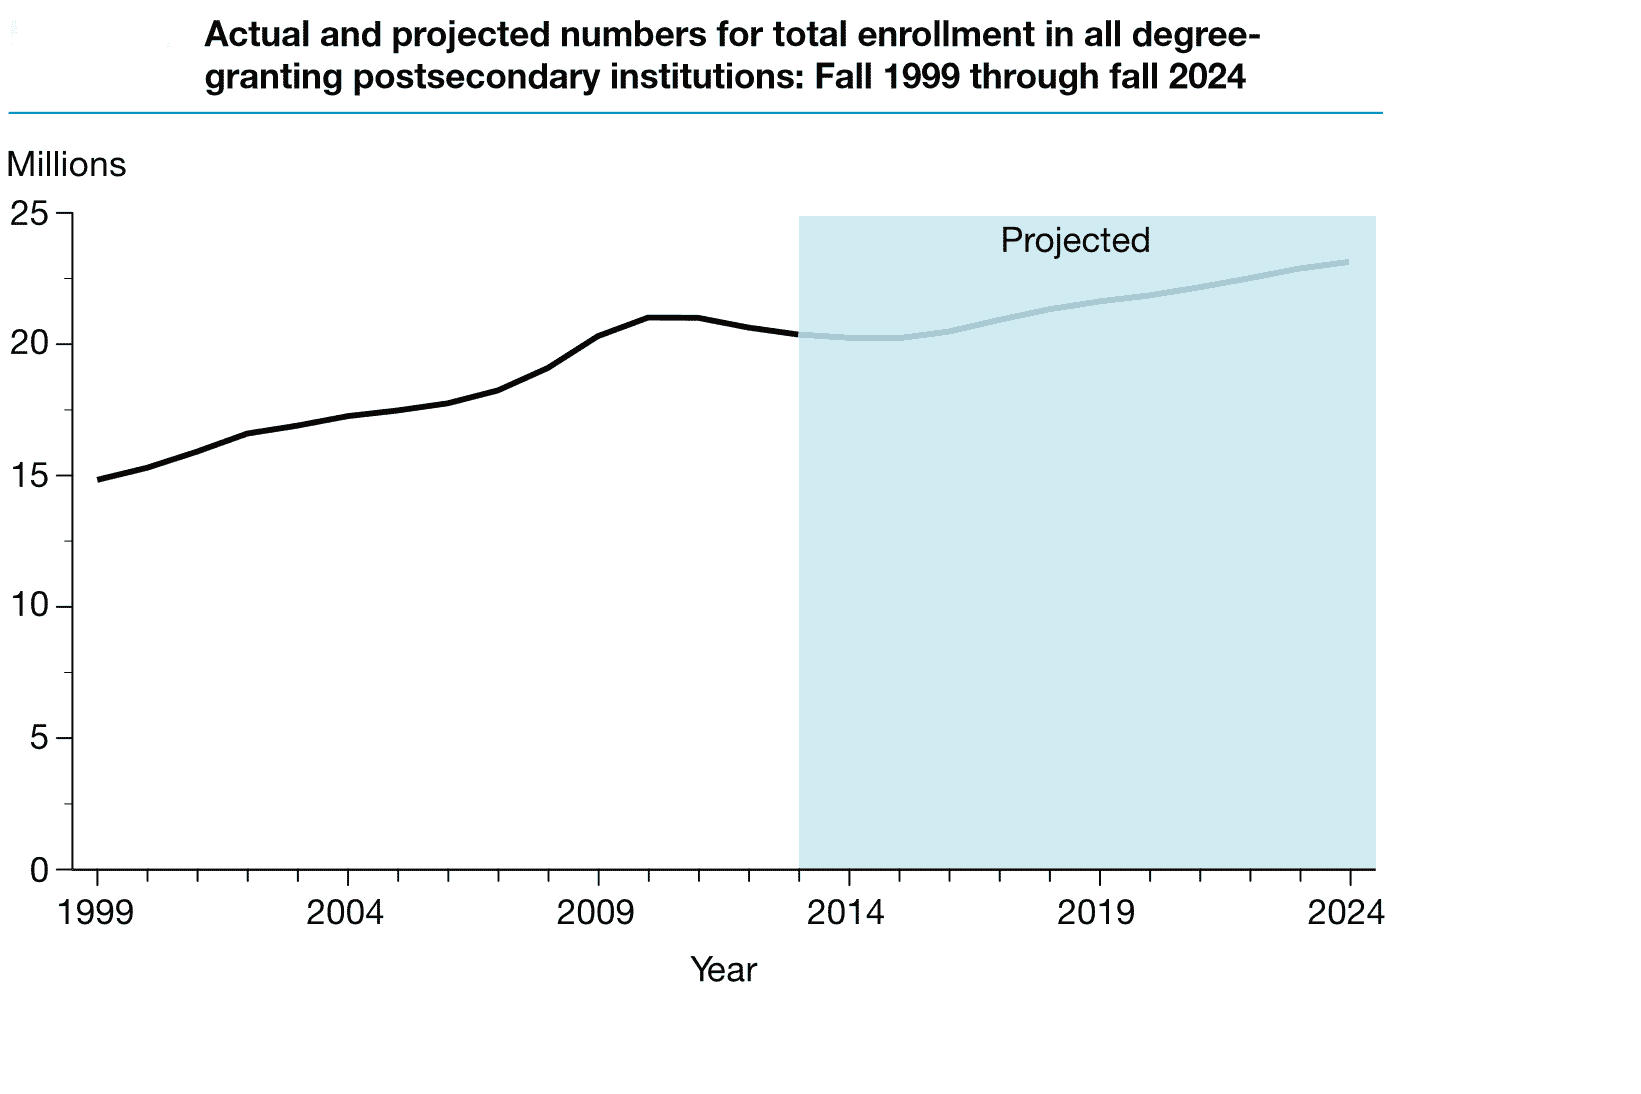
Actual and Projected total enrollment for all degree-granting colleges from 1999 to 2024.
Growing College Enrollment by Age
The next graph summarizes the actual and projected total enrollment for degree-granting colleges and universities by age group. The defined time-periods are Fall of 1999, Fall of 2013, and Fall of 2024. As you can see, enrollment numbers continue to trend upwards for all age groups for each time frame in the study.
The 18-24 cohort: a 40% lift in enrollment from 1999 to 2013 with a projected 13% increase from 2013 to 2024.
The 25-34 cohort: a 41% increase in enrollment from 1999 to 2013 with a 7% projected rise from 2013 to 2024.
The over 35 cohort: an increase of 25% in enrollment for students over 35 from 1999 to 2013 with a 10% life expected through 2024.
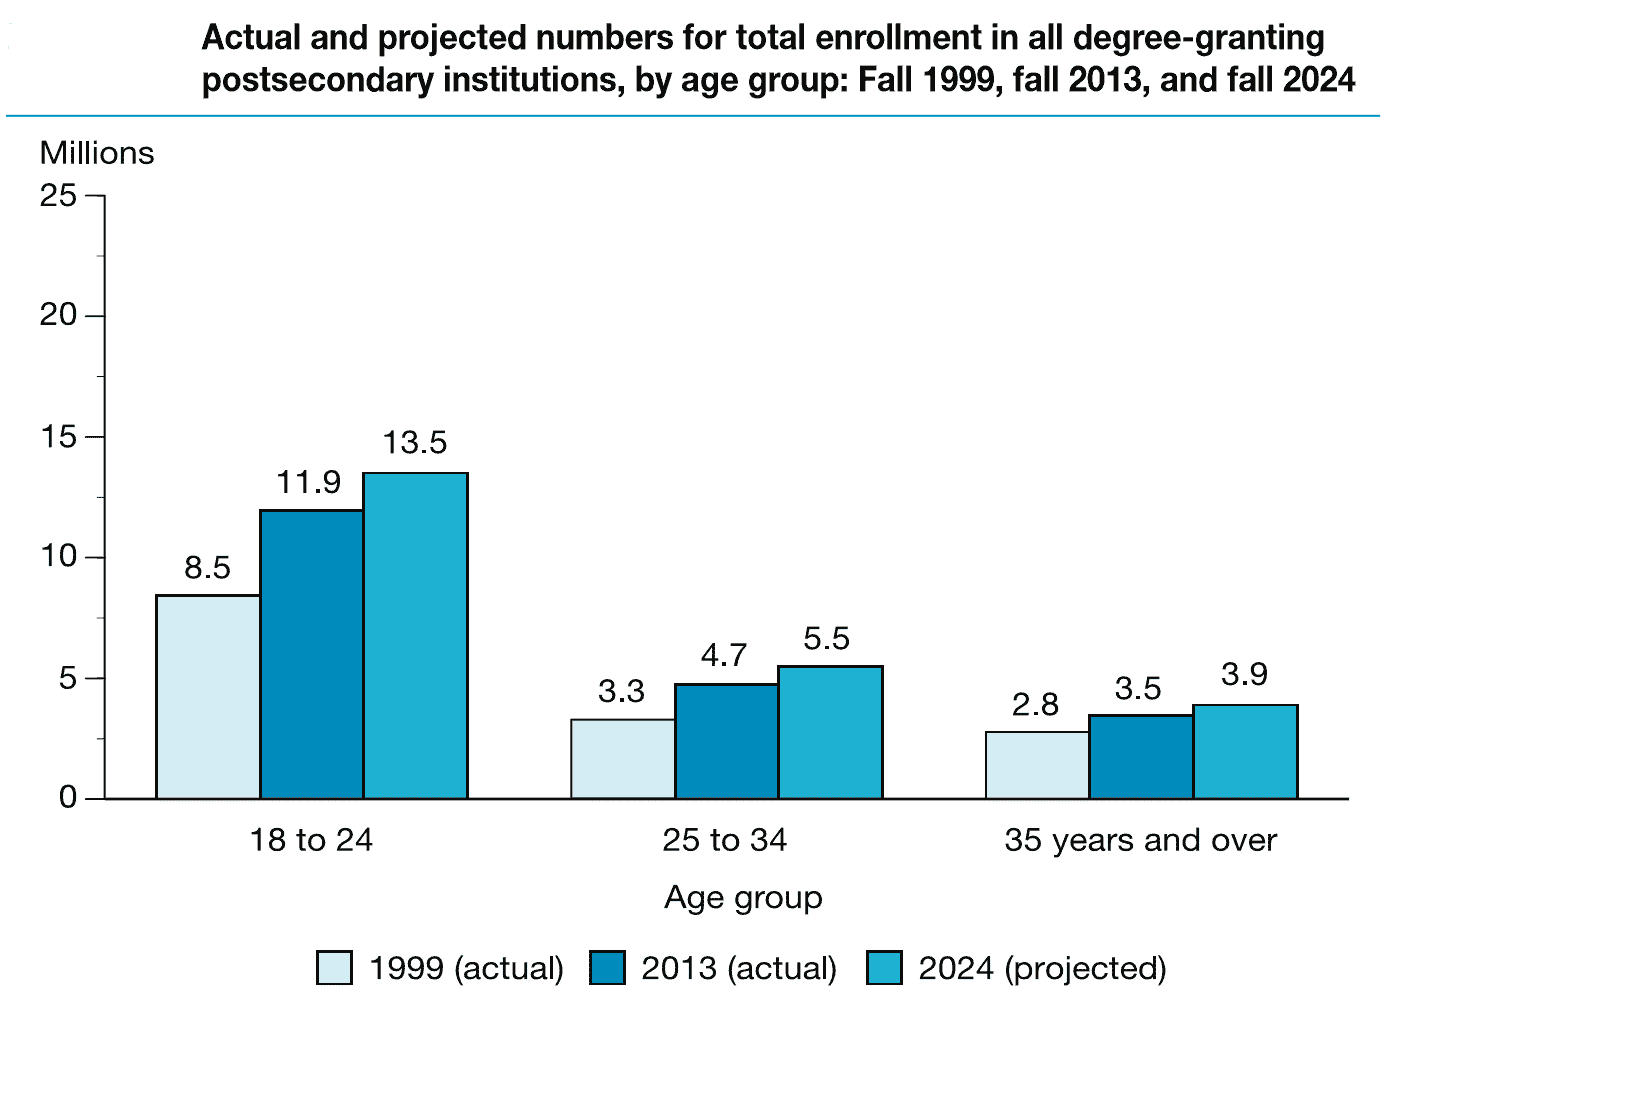
Actual and projected total enrollment by age for all degree-granting colleges from 1999 to 2024.
Growing College Enrollment by Gender
As see in the graph below, the survey from the U.S. Department of Education depicts growing enrollment numbers for both male and female. From 1999 to 2013 there was an increased enrollment in college of 36% for males and 38% for females. Going forward, there is a projected college enrollment boost of 11% for men and 16% for women from 2013 to 2024.
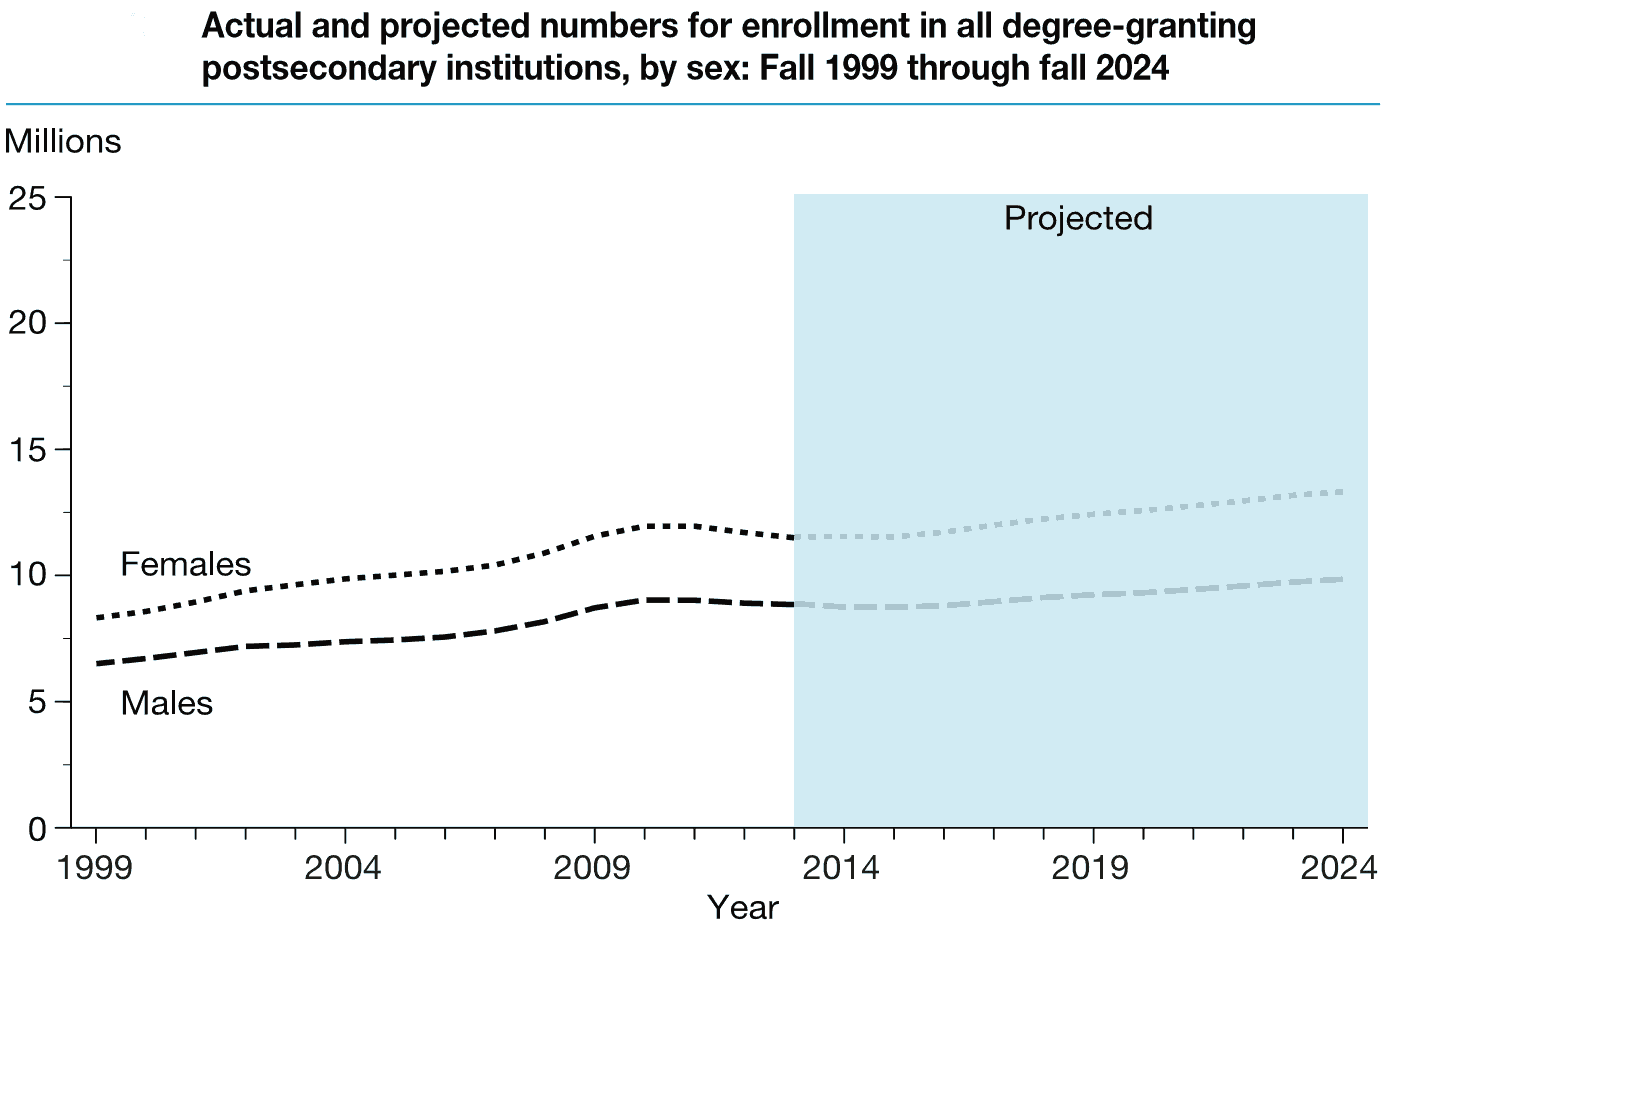
Actual and projected total enrollment by gender for all degree-granting colleges from 1999 to 2024.
Growing Full-Time and Part-Time College Enrollment
The next set of data summarizes the total enrollment by full-time and part-time enrollment status. For college students enrolled full-time, there was a rise of 43% from 1999 to 2013 with a projected bump of 14% from 2013 to 2024 expected. For part-time college students, there was a 29% ascent from 1999 to 2013 with a projected lift of 13% from 2013 to 2014.
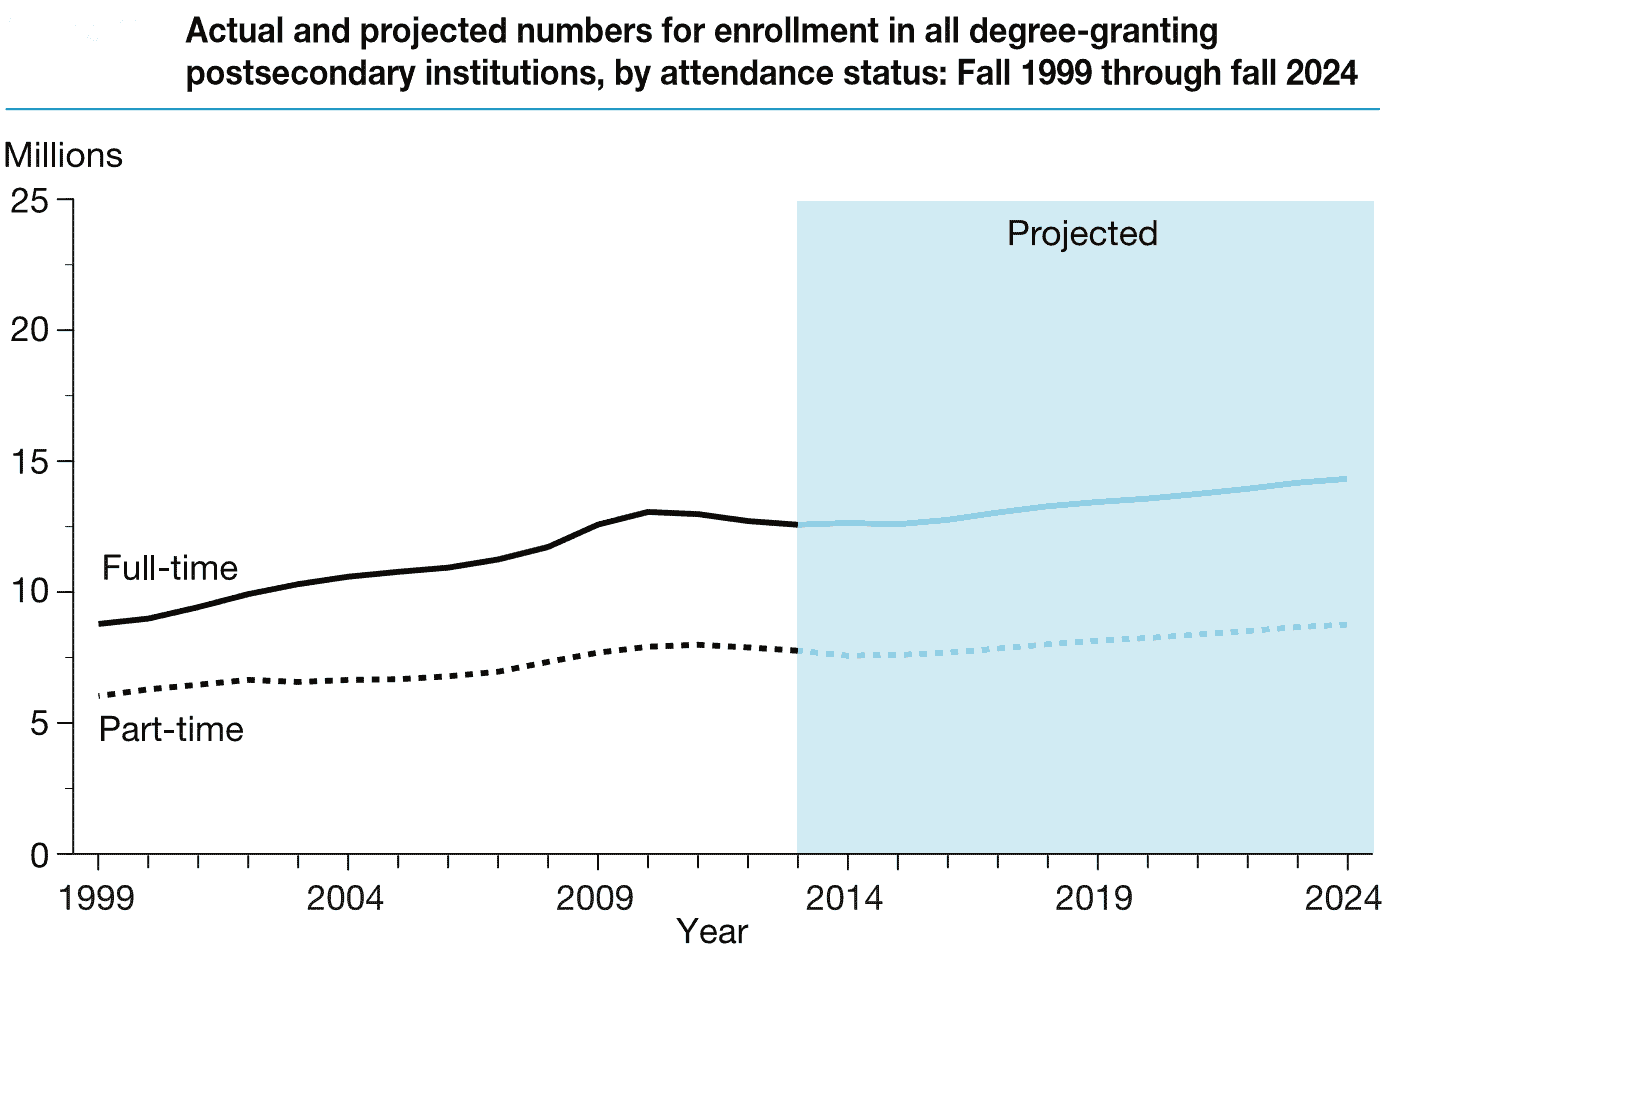
Actual and projected total enrollment by attendance status for all degree-granting colleges from 1999 to 2024.
College Growth by Degree Level
The next graph indicates a growing trend in college enrollment by colleges and universities by level of degree. As you can see, there was an increase in undergraduate and graduate enrollment of 37% each. Enrollment in undergraduate studies are predicted to grow 12% between 2013 and 2024 while postgraduate enrollment is projected to increase at a 20% clip during the same time frame.
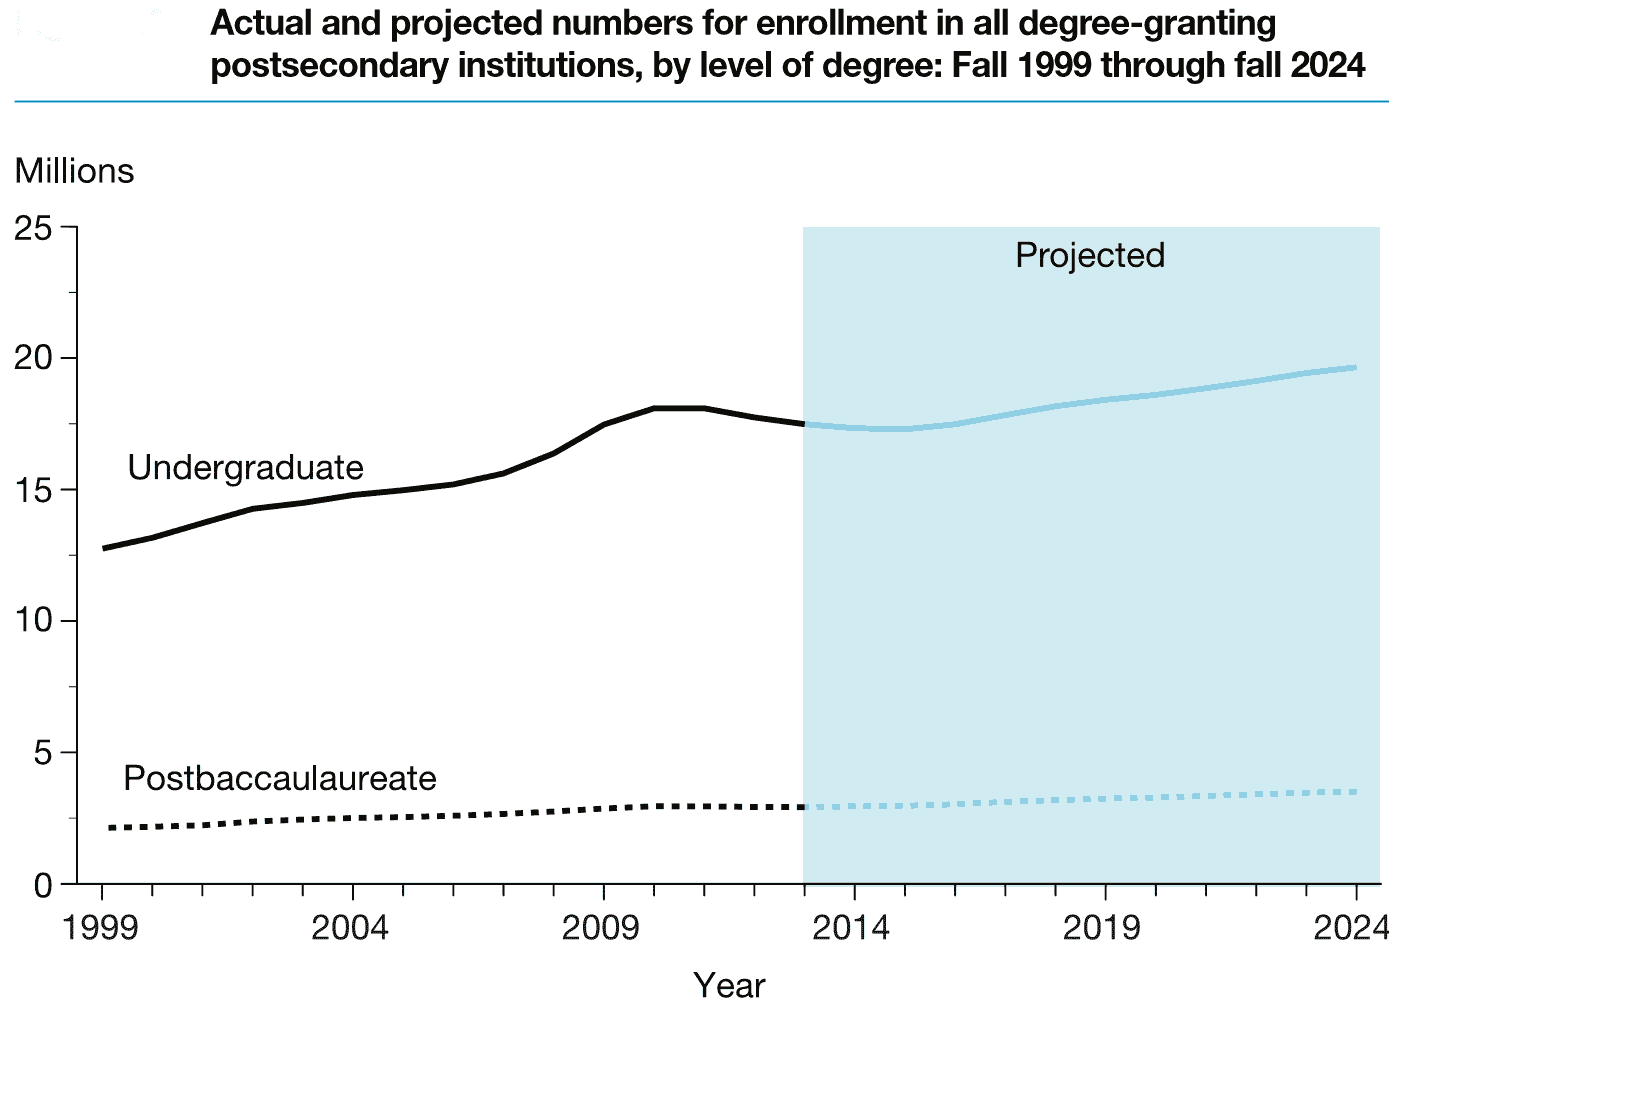
Actual and projected total enrollment by degree level for all degree-granting colleges from 1999 to 2024.
Public and Private College Enrollment Trends
Next, the NCES has compiled information on the growing enrollment trends by institution type. Public Colleges and Universities have seen enrollment jump by 30% from 1999 to 2013 with a projected increase of 13% through 2024. On the other hand, private colleges have seen a whopping 62% increase in enrollment from 1999 to 2013. Private colleges and universities are expected to see a 14% rise in enrollment from 2013 to 2024.
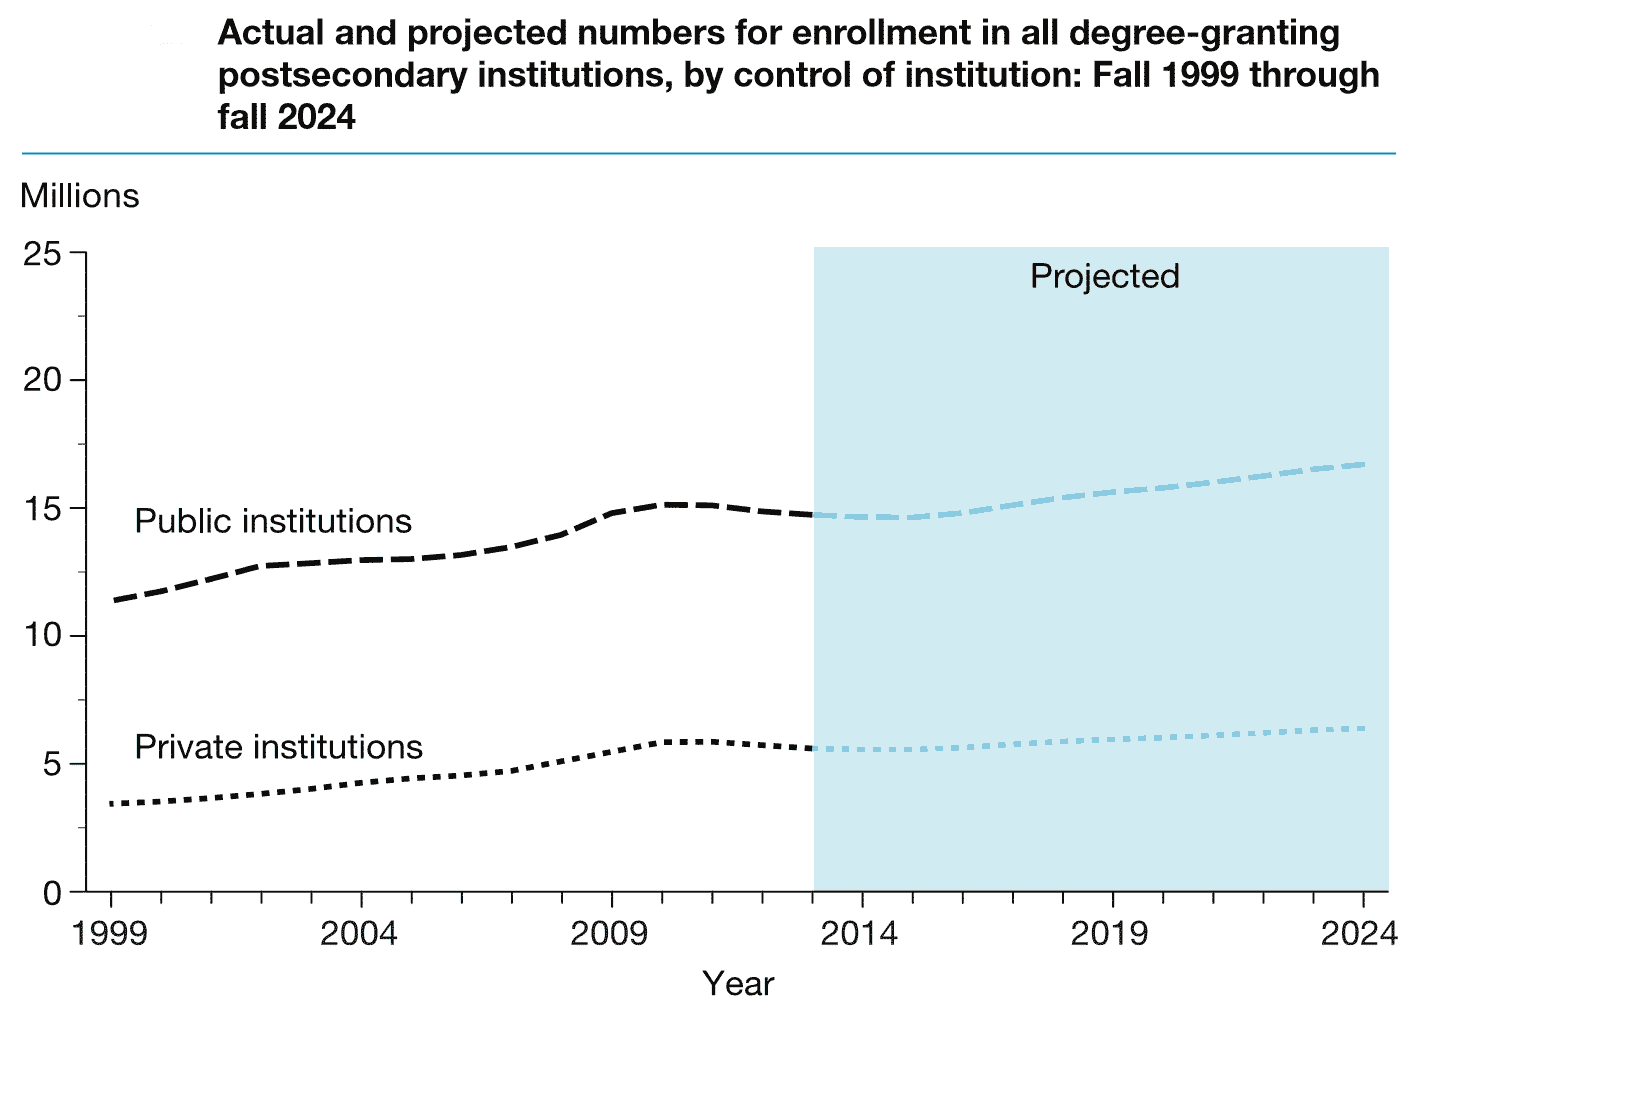
Actual and projected total enrollment by institution type for all degree-granting colleges from 1999 to 2024.
College Freshman Enrollment Growth
The final graph summarizes growth and projections for first-time college freshman by gender and aggregate totals. The total enrollment of first-time freshman saw growth of 27% from 1999 to 2013 with an expected trend of a 12% rise through 2024. Both males and females saw an increase of 26% in enrollment from 1999 to 2013. The enrollment projection for males for 2013 to 2024 is expected to grow 9% while female enrollment is anticipated to grow by 15% during that time.
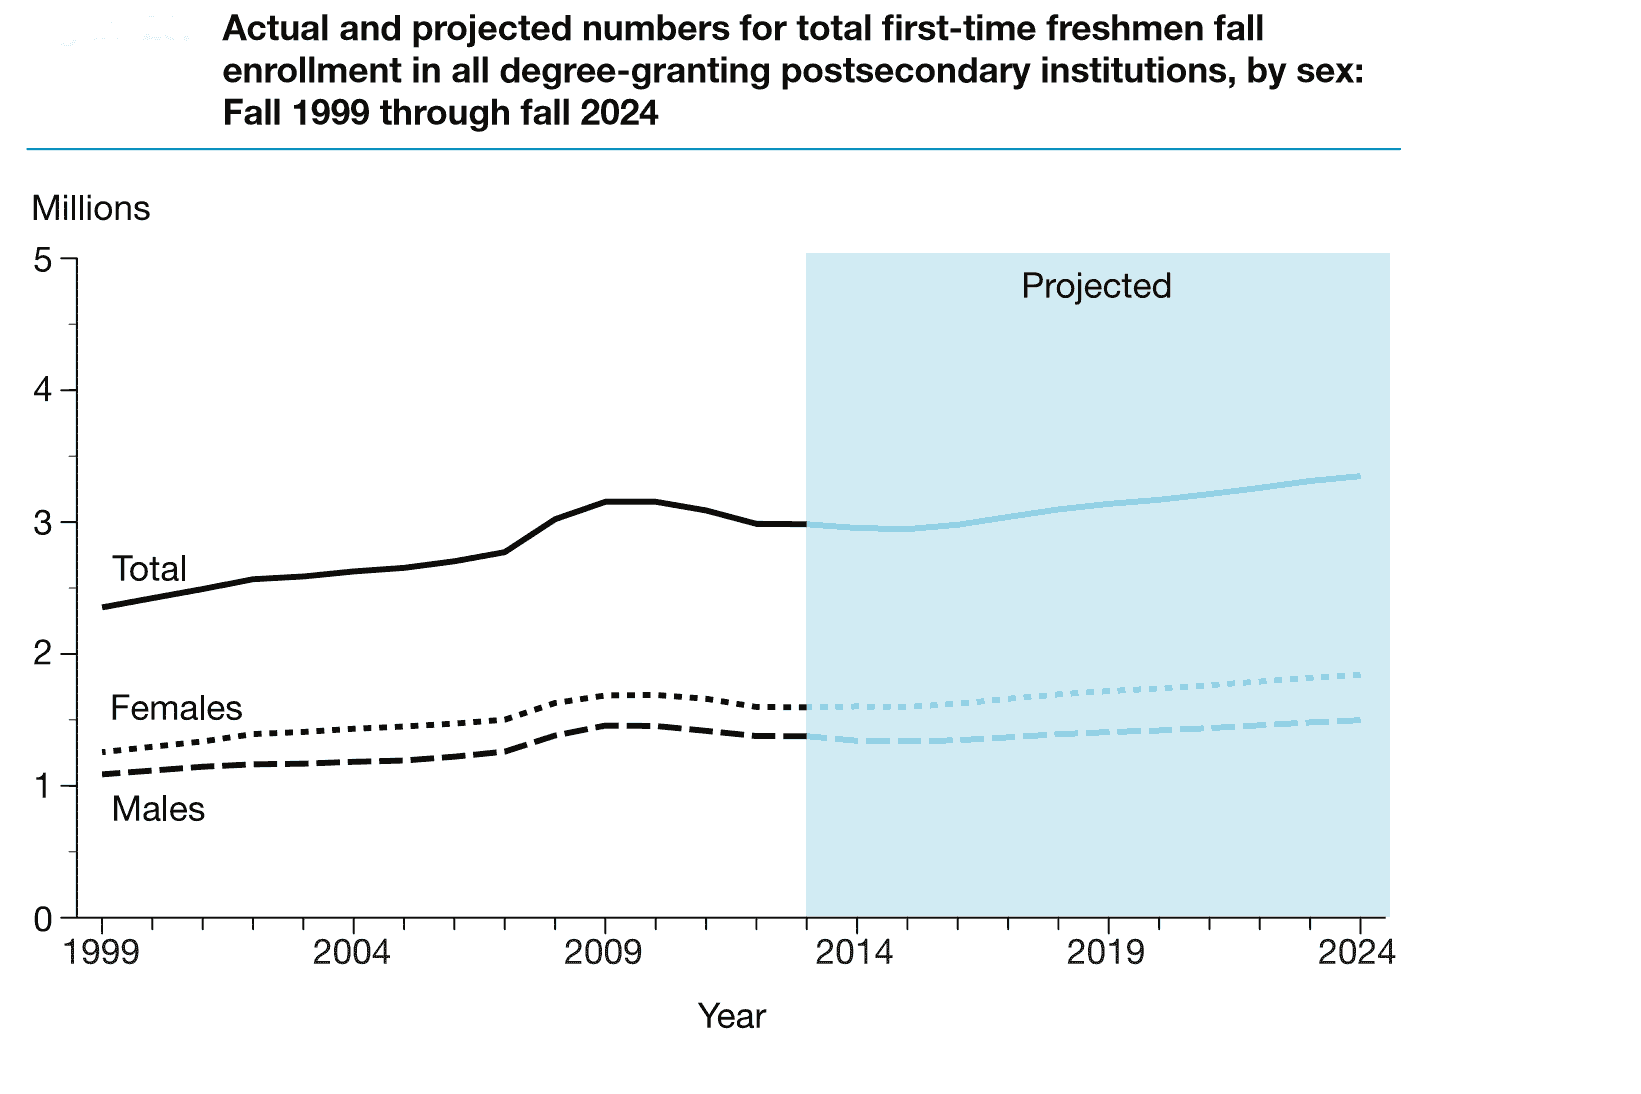
Actual and projected total enrollment for first-time freshman for all degree-granting colleges from 1999 to 2024.
All in all, the growth in post-secondary enrollment indicates the value placed on higher education will continue to play a major part in the future as it has in the past. Investing in education is a laudable goal with tangible outcomes based on the myriad studies performed by the Department of Education, Department of Labor Statistics, and private entities around the globe.
Colleges in Your State
Assemble information about colleges in your state with our dedicated pages below. Each state page has a list of public colleges, private universities, community colleges, bible colleges, and liberal arts colleges for that state. Additionally, we have broken down key professional degrees by state for veterinary medicine, med school, physical therapy, nursing, law school, and pharmacy school.
For additional resources, make sure to visit MatchCollege and subscribe to our blog for the latest in college information.